To data-oriented design follows data-oriented optimization, that is: reason about a problem in view of the data you’re going to transform and seek optimization opportunities.
Today I want to look at a finite element analysis (FEA) in which 80% of the time goes into collision detection. Particularly in the final stage of it, where we first test primitives for collision, and finally we compute reaction forces for those primitives in contact. These functions are crucial and challenging for many applications, from robotics to computer graphics, but in FEA we need a greater degree of accuracy. This triggers high-computing costs, but let’s see if we can reason about the problem and improve the current state of the art.
Before getting started
There are few things to set:
- Replace the force inline statements with
__attribute__((__noinline__))so that profiling may be more informative - Build with default
RelWithDebInfofrom CMake so that both optimisation and debug symbols are included - Set
-march=nativeto make the most of the vector instructions on my machine
Now I can start profiling my application.
Data-oriented optimization
Building with Apple Clang 15 I get this high-level profiling information:
| Task                 | CPU (sec)  | (%)  |
|----------------------|------------|------|
| Element processing   | 2.6597E+00 | 3.6  |
|   Internal forces    | 2.3526E+00 | 3.2  |
|   Solve equations    | 3.4086E-01 | 0.5  |
| Contact algorithm    | 5.9047E+01 | 80.9 |
|   Traverse trees     | 6.8024E-05 | 0.0  |
|   Primitive test     | 5.8873E+01 | 80.7 |
| Generate output      | 1.0176E+01 | 13.9 |
|   Binary             | 3.6518E-02 | 0.1  |
|   Ascii              | 1.0116E+01 | 13.9 |
| Unmeasured           | 1.1099E+00 | 1.5  |

**Total CPU time: 72.99**
Basically this is the program output saying that we should focus on the primitive tests, as these alone take 80% of the whole FEA simulation. Now I’m going to dive deeper and run this with the Instrument profiler (awesome tool by the way).
Apple Instruments give me a slightly different runtime (total runtime 83.60s), but the function that tests for collision a pair of quadrilaterals takes 19 sec distributed as follows:
- 48.8% in a function that finds the intersection between two polygons in 2D
- 15.0% for a simple dot product between two 3D vectors
- 3.2% in normalising 3D vectors
- 0.2% in cross product computation
I’m going to take a stab at the dot products first since earlier I wrote about using SIMD to optimise the dot product in view of further data-oriented tasks.
The current implementation is trivial scalar implementation:
inline double VecDotProd3d( double* a, double* b )
{
  return( a[ 0 ] * b[ 0 ] + a[ 1 ] * b[ 1 ] + a[ 2 ] * b[ 2 ] );
}
Compiler explorer gives an assembly on Clang 15 that resembles the one I get from my Apple Clang 15:
+0x00	pushq       %rbp
+0x01	movq        %rsp,          %rbp
+0x04	movq        %rdi,          -0x8(%rbp)
+0x08	movq        %rsi,          -0x10(%rbp)
+0x0c	movq        -0x8(%rbp),    %rax
+0x10	movsd       (%rax),        %xmm1      ## xmm1 = mem[0],zero
+0x14	movq        -0x10(%rbp),   %rax
+0x18	movsd       (%rax),        %xmm2      ## xmm2 = mem[0],zero
+0x1c	movq        -0x8(%rbp),    %rax
+0x20	movsd       0x8(%rax),     %xmm0   ## xmm0 = mem[0],zero
+0x25	movq        -0x10(%rbp),   %rax
+0x29	mulsd       0x8(%rax),     %xmm0
+0x2e	mulsd       %xmm2,         %xmm1
+0x32	addsd       %xmm0,         %xmm1
+0x36	movq        -0x8(%rbp),    %rax
+0x3a	movsd       0x10(%rax),    %xmm0  ## xmm0 = mem[0],zero
+0x3f	movq        -0x10(%rbp),   %rax
+0x43	movsd       0x10(%rax),    %xmm2  ## xmm2 = mem[0],zero
+0x48	mulsd       %xmm2,         %xmm0
+0x4c	addsd       %xmm1,         %xmm0
+0x50	popq        %rbp
+0x51	retq
Out of the 11.68s spent in dot product computation, the 6 most expensive operations, with addsd and mulsd at the top 3, are:
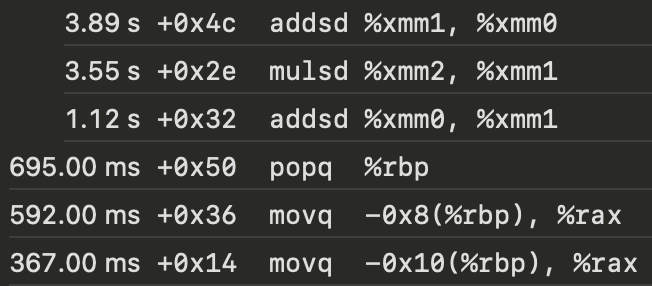
My x86 CPU does have AVX support, and I’m going to test whether replacing addsd and mulsd with their vector counterpart will give me a x4 speedup. The vector function is in this previous post, and I’m going to make some changes so that the function signature remains unchanged - and I trust the compiler all that.
First attempt: add intrinsics
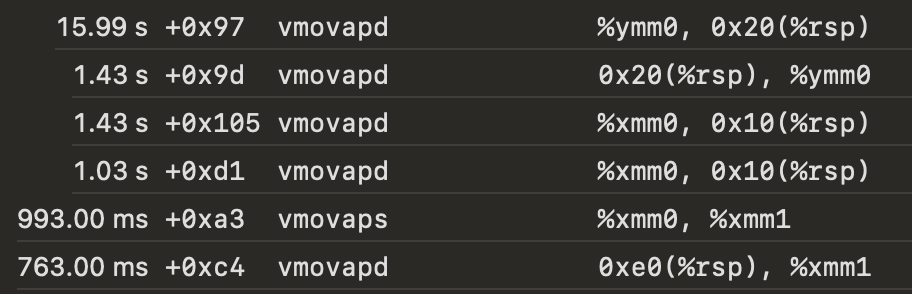
The instruction set now uses ymm registers, but the results are not as I expected: the time for dot product computations goes up from 11.86s to 31.59s! Surprisingly vadd* and vmul account to less than 500 ms, but now the most expensive operations now are vmovap*:
Second attempt: aligned data
I was absolutely wrong in trusting that the compiler would lay the memory in the right way: the vector function is now spending time in loading unaligned data from memory. This is slow and the compiler cannot do anything better.
I edit the function and its signature as follows:
inline double VecDotProd3d(const double* restrict a, const double* restrict b){
    const __m256d vec_a = _mm256_load_pd(a);
    const __m256d vec_b = _mm256_load_pd(b);
    const __m256d prod = _mm256_mul_pd(vec_a, vec_b);

    const __m128d sum_high = _mm256_extractf128_pd(prod, 1);
    const __m128d sum_low = _mm256_castpd256_pd128(prod);
    __m128d sum = _mm_add_pd(sum_low, sum_high);

    sum = _mm_hadd_pd(sum, sum);

    return _mm_cvtsd_f64(sum);
}
Conclusions
Now data gets loaded into registers from aligned chunks of memory - if not, I’d get a crash - and this gives a boost by more than 10%. I put back the function inlining for this final comparison, and this is the result for the primitive tests function:
| Time | |
|---|---|
| Old method | 65.5 s |
| New method | 53.2 s |
This looks good, but far from x4 speedup I expected.
I can get more information from the profiler.
When I look at how data are transformed in the disassembly I see that about 20 calls to vmovapd appear and these shuffle the data on stack. The actual multiplications and additions are done in about 500ms, but Instruments shows that overall about 4s are used to move data up and down the stack.
The 10% gain is enough for today: give how little code I had to change, this is a significant speedup for a large codebase. The way to improve further is rather invasive: refactor more code to pass register variables and avoid calls to vmovapd. But again, enough for today.