Look beyond your compiler

Inspect, debug and analyse assembly code to create better solutions
:hourglass: 10 min read.
Compilers are black boxes, yet they can make all the difference at for low-latency applications. This page collects tools that I use to test and analyse what my compiler does. Now, because I didn’t study CS this stuff is pretty unknown to me and learning was not easy. But my rationale for learning assembly code is very important: performance analysis. I’m not talking about fine-tune optimisation, here I’m referring to the “refactoring” step in a standard TDD cycle; after all tests pass, it’s time to give your code a good cleanup. That’s when I want to ensure that the data flow as I expect them, that’s when I finalise data structures, if-else branching, and loops.
I’m going to write about these three tools:
but first some motivations.
Why should we care about assembly?
Assembly code (asm) is the low-level code generated by the compiler for you. That code is still your code and so you should simply care about it. By inspecting, analysing and debugging asm we can improve memory access to gain performance boost.
How to begin this journey into asm?
CS PhD’s will tell you a different story.. but here is mine.
At the very beginning I used to look at the compiler’s output and simply google every single instruction. A bit of Youtube and I started to pretend I knew what I was looking at. I guess we’ve all been there for a topic or another.
My problem however was that I did not have the basics: I did not know what was a registry and how this could fit in my CPU. That’s where I really started to learn. I recommend starting from the CPU and for a hands-on engineer like me this picture was a breakthrough:
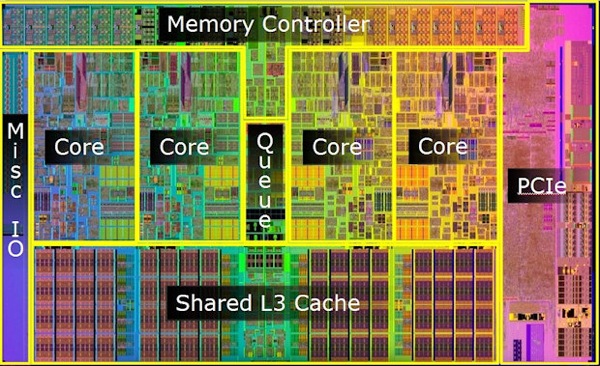
The layout of this Intel CPU shows 4 cores and a shared L3 cache. Somewhere down the line there is the actual RAM and disk. Each core will have its own L1 and L2 cache slots somewhere. No wonder why memory access is the most time consuming and energy consuming task. While executing a function call takes few CPU cycles, filling a registry with data from the RAM takes hundreds of cycles. Even intuitively we can guess that because, however fast light may be, the physical distance between the core and the L3, let alone the RAM, it’s massive compared to the L1 cache. We can also see that multi-core CPUs clearly have data races and syncronisation issues we may not even think of.
From a performance analysis point of view, from asm you can look at paging, vectorisation, struct padding, inlining and possibly more. The first we can look for is an estimate, based on asm code, the cost of those hot lines of your kernel.
Example: branching with switch
Some people understandably dislike switch. Why? Try compiling this simple case:
int id;
switch(id)
    case 1:
        printf("Hello\n");
        break;
    case 2:
        printf("World\n");
        break;
    default:
        printf("Foo\n");
        break;
GCC 7 and -O2 get you the following:
.LC0:
        .string "%d"
.LC1:
        .string "Hello"
.LC2:
        .string "World"
.LC3:
        .string "Foo"
main:
        sub     rsp, 24
        mov     edi, OFFSET FLAT:.LC0
        xor     eax, eax
        lea     rsi, [rsp+12]
        call    __isoc99_scanf
        mov     eax, DWORD PTR [rsp+12]
        cmp     eax, 1
        je      .L2
        cmp     eax, 2
        je      .L3
        mov     edi, OFFSET FLAT:.LC3
        call    puts
.L5:
        xor     eax, eax
        add     rsp, 24
        ret
.L2:
        mov     edi, OFFSET FLAT:.LC1
        call    puts
        jmp     .L5
.L3:
        mov     edi, OFFSET FLAT:.LC2
        call    puts
        jmp     .L5
It’s very simple to distinguish the three cases, and it’s generally easy to see that eax is moved, copied and xor’d a few time before the right cases is invoked. All these have a cost that we can now quantify and reduce based facts and based on data.
Godbolt
Godbolt the compiler explorer that Matt Godbolt created is becoming a one-stop-shop to see what compiler spits out. My personal experience is that with Godbolt I started realising that C, C++, Fortran are just clever interfaces. I realised that between my code and the hardware there were a lot of things I did not know - because I did not do CS.
Godbolt has large variety of compiler in different versions. Recently Godbolt started to support CMake: here’s a deep dive of CMake in Godbolt, check it out!
When do I use Godbolt?
- When fixing compiling issues from a specific compiler without actually installing it.
- When learning C-to-asm. Linus Torvalds claims to see asm when looking at C, I don’t. But I can fix this.
- When testing little code snippets. I just open the browser, select a compiler from hundreds and set the flags I want.
- When I want to study templates. I’ll never get the template logic, but if I do it’s because of Godbolt.
Thanks Matt Godbolt 🙏!
C++ Insights
By Andreas Fertig, C++ Insights allows see the code with the eyes of a compiler - that’s its motto. This is another useful tool; however, this is not what the compiler actually sees. It is the best guess the developers of C++ Insights can provide us. It comes with few examples; one is with auto of course. Another, that strikes me the most, is a simple and innocent lambda.
Inspecting what auto does it’s a personal thing. Some days I’m like “yeah, let’s auto all”, some other days I’m literally the opposite and blame lazy typing. I get it, it’s more than being lazy! Perhaps it was never even designed to favour laziness. Maybe auto has always been about crazy advanced templation of templates… yeah, whatever. Today I don’t like it. I may change my mind tomorrow. Back to C++ Insight.
I’m not a C++ guru and I come from C. With C++ Insight I learned most of the false friends these two languages have. For example: it’s ok not to return in C++. Oh, that’s annoying - I thought. But with C++ Insight you can see a return 0 is added without having to open the C++ standard, or even without googling.
For loops with iterators are also very not obscure anymore. Consider for(const char& c : arr) and it becomes:
const char * __begin1 = __range1;
const char * __end1 = __range1 + 10L;
for(; __begin1 != __end1; ++__begin1) {
    const char & c = *__begin1;
}
There you have 2 more pointers and it’s left-increment. If Linus sees asm from C, perhaps a similar wizard sees C in C++… but I don’t. But with C++ Insight I can learn, thank you Andreas 🙏.
Quick benchmarks
Check out Quick benchmarks by Fred Tingaud. You can get your code transferred from Godbolt or C++ Insight directly to Quick benchmarks in just a click - look at the top banner.
Quick benchmarks run on the Google Benchmark, nowadays’ de-facto test and benchmarking toolkit for C++, and it carries all the advantages of Godbolt: you can run tests without installing a single compiler and not even the testing framework.
Again, the beauty is that it allows you to test performance of production code. There I said it. Why would I run my production code on a random website? Have I haven’t forgotten about IP obligations? No, and I know that the volatile machine Quick Benchmarks run onto is busy.. but actually, you can run this app locally!
I haven’t found copy-paste tutorial on how to run Quick C++ benchmark, and so here it is. Take the following snippet:
static void StringCreation(benchmark::State& state) {
  for (auto _ : state) {
    std::string created_string("hello");
    benchmark::DoNotOptimize(created_string);
  }
}
// Register the function as a benchmark
BENCHMARK(StringCreation);

static void StringCopy(benchmark::State& state) {
  std::string x = "hello";
  for (auto _ : state) {
    std::string copy(x);
  }
}
// Register the function as another benchmark
BENCHMARK(StringCopy);
You’ll get to outputs: a comparison and an in asm report.
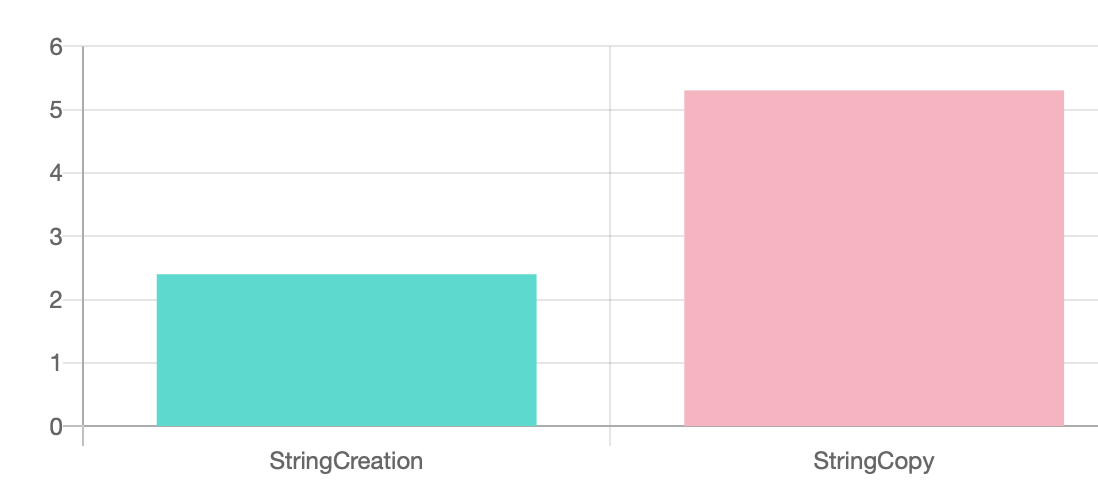
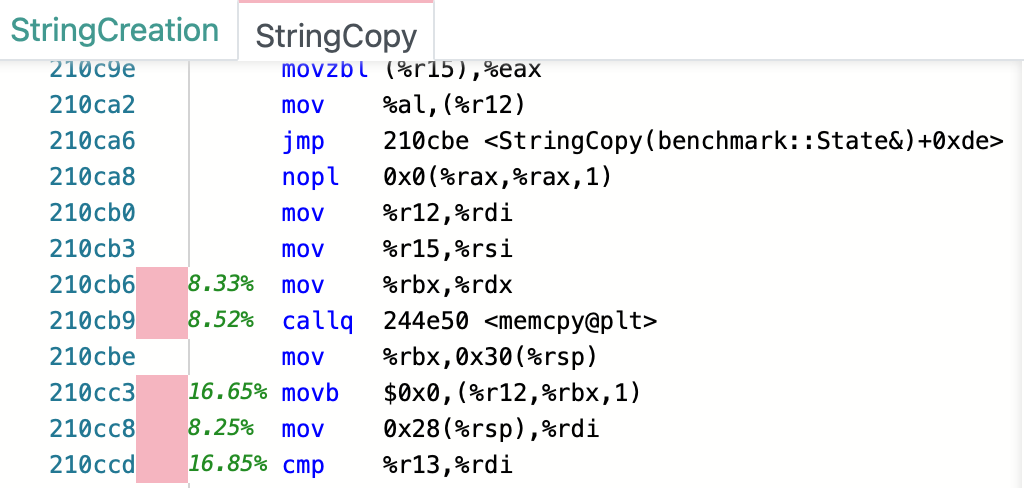
It’s very detailed. It’s easy to deploy to the whole team if you use Docker. It provides quick insights right next to the asm code. I find it very insightful and effective. Little fuzz, no clunky UI. Just data that can guide your code refactoring during TDD.
If one of my CS friends could prove me wrong and wants me to tune down my enthusiasm for Quick Benchmarks, please reach out. Otherwise, I find Quick Benchmarks really awesome. I love it Fred 🙏.
What’s next? Demystify vectorisation
If you were born in the past century, you may have heard that careful memory allocation is what it takes to enforce vectorisation. Well.. Memory allocation and memory access are two different things. Compiles are clever and will vectorise whatever is possible, but it takes a real brain to avoid cache misses.
From asm however we can reason on the vectorisation performance. I’d start off by nail down XMM registry on this great answer I found on Stack Overflow, or this webinar. Wait a minute.. I’m back to square one! 🤬! I’m googling things I don’t know 😣😣😣.
As always, learning continues..